Performance
- Summary — clicks, impressions, CTR and average position with period-on-period change
- Daily trend
- Top pages
- Top queries

Pick the sections you need, the period and the comparison, then run the report on demand or let it arrive every Monday. Recipients get the numbers with the source printed at the bottom.
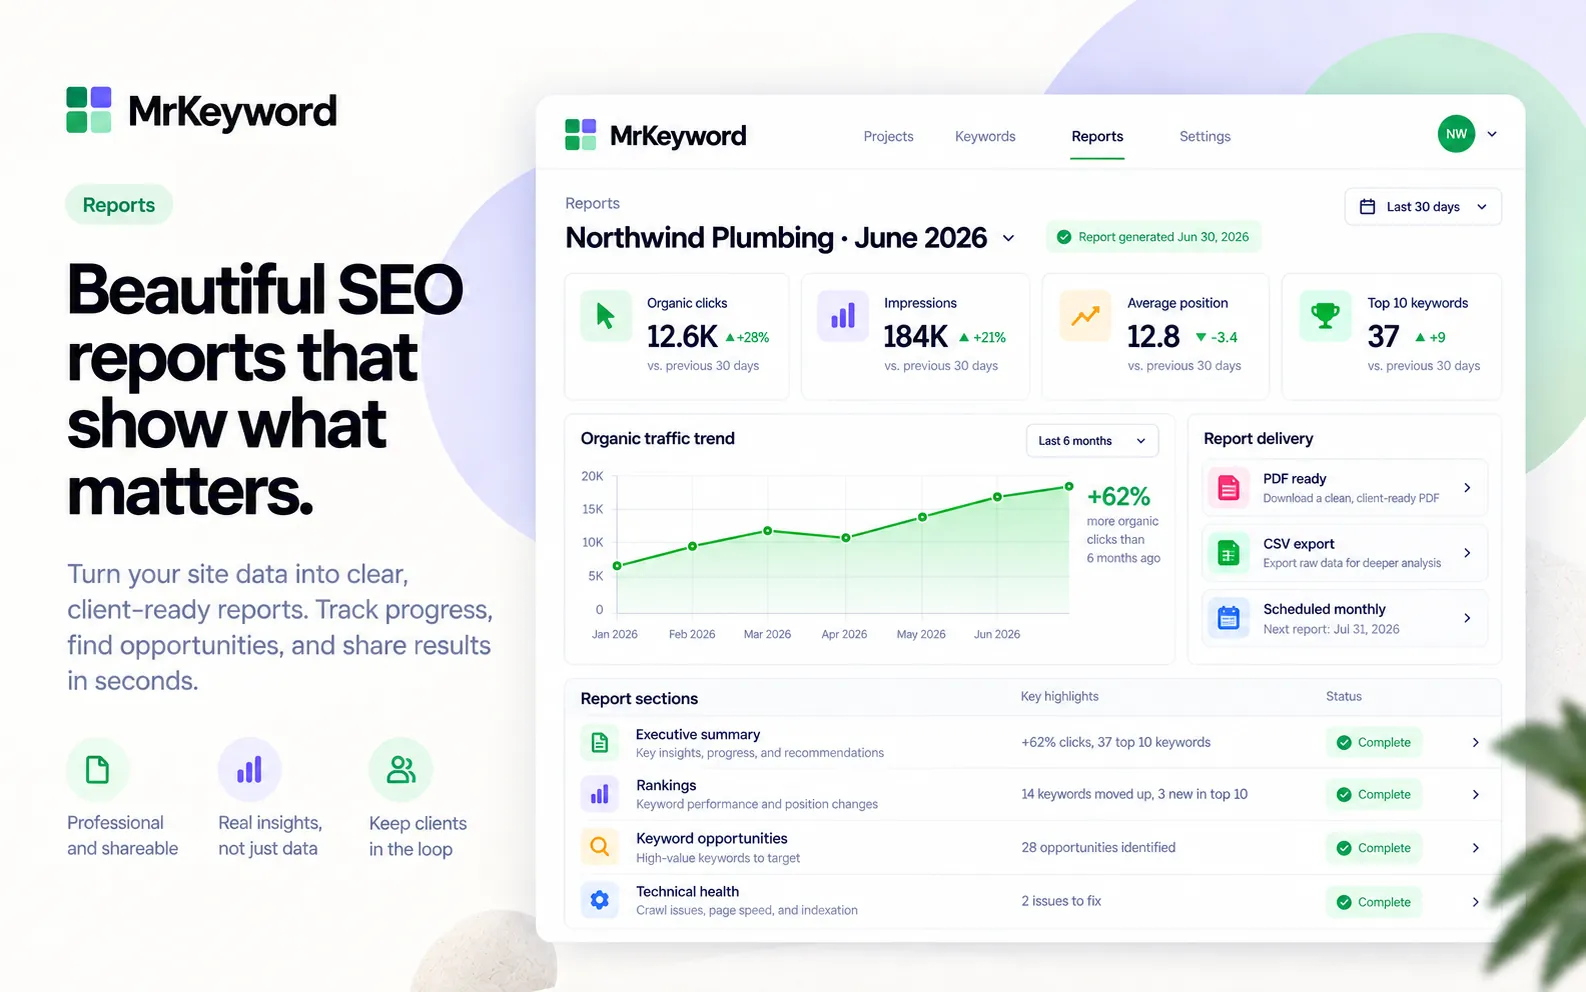
Performance summary, daily trend, top pages, top queries, devices, countries, tracked keywords, a rank tracking overview and content ideas. Choose a period of 7, 28, 90, 180 or 365 days, and compare it with the previous period or with nothing at all.
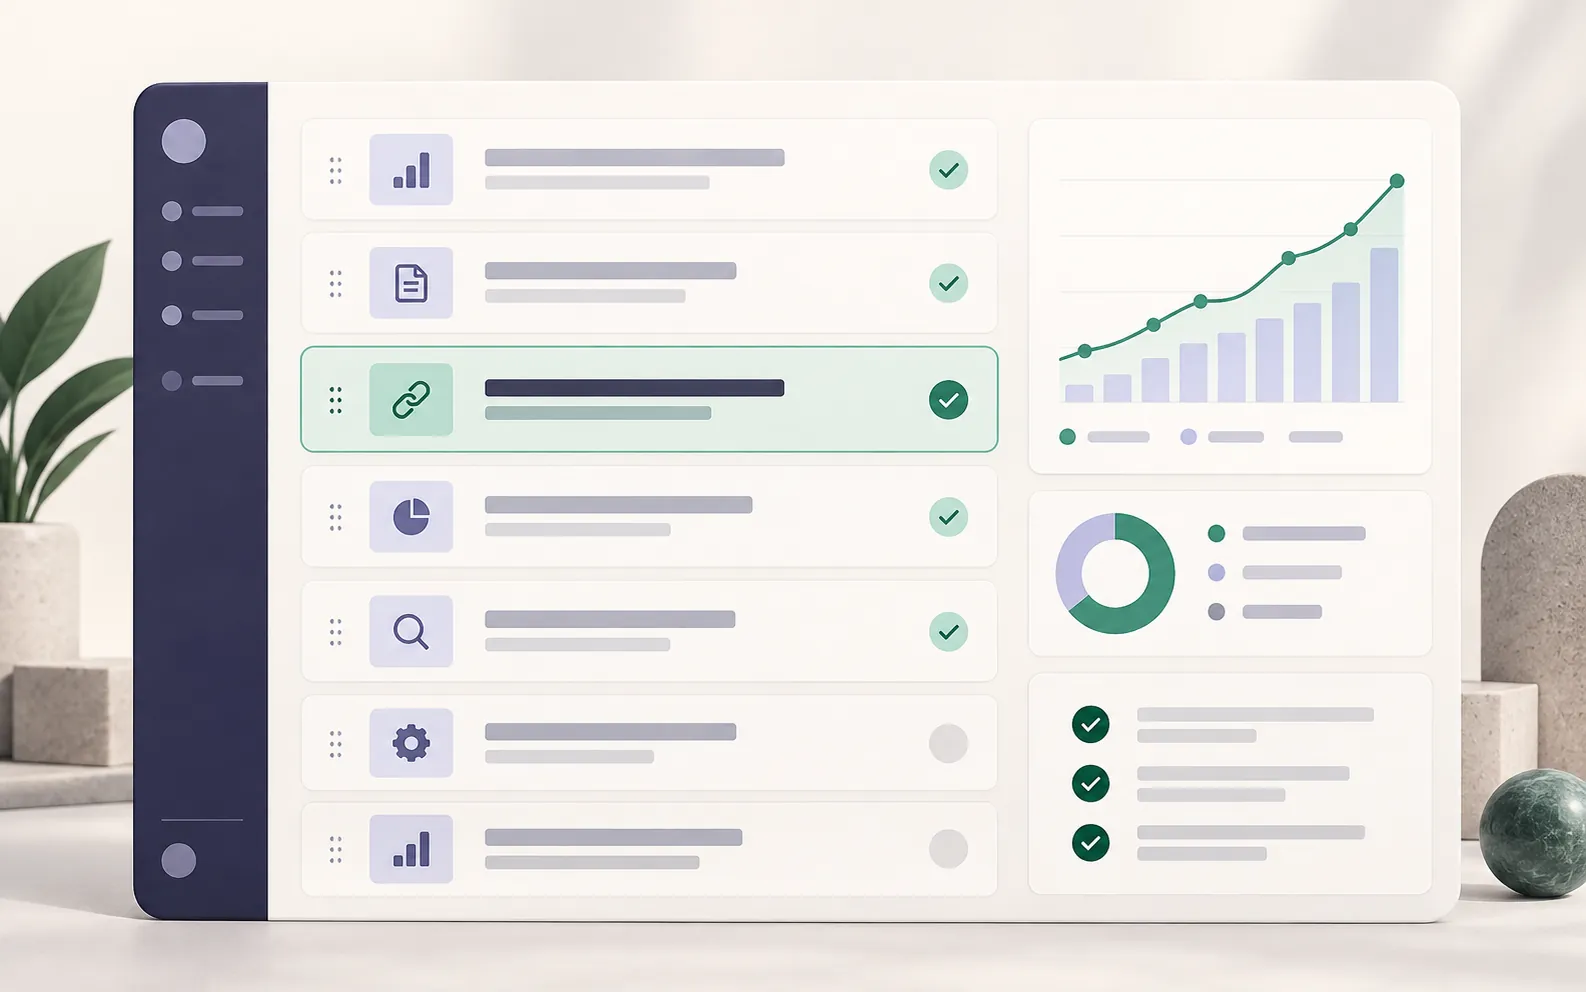
A report is a rendering of the daily Search Console rows already stored for the website — the same rows the Rankings and Queries tabs read. Nothing is recalculated for the PDF, so a report and the app never disagree. Connect your AI assistant over MCP and it reads those same stored rows, so the write-up it drafts for a client cannot contradict the document you attach to it.
Summarise this month's search performance for the client.
Tools usedget_site_summaryget_work_items
Choose a weekly or monthly cadence, keep the recipient list with the report, and let the workspace retain a run history. Your team sees when a report was sent and whether a run needs attention.
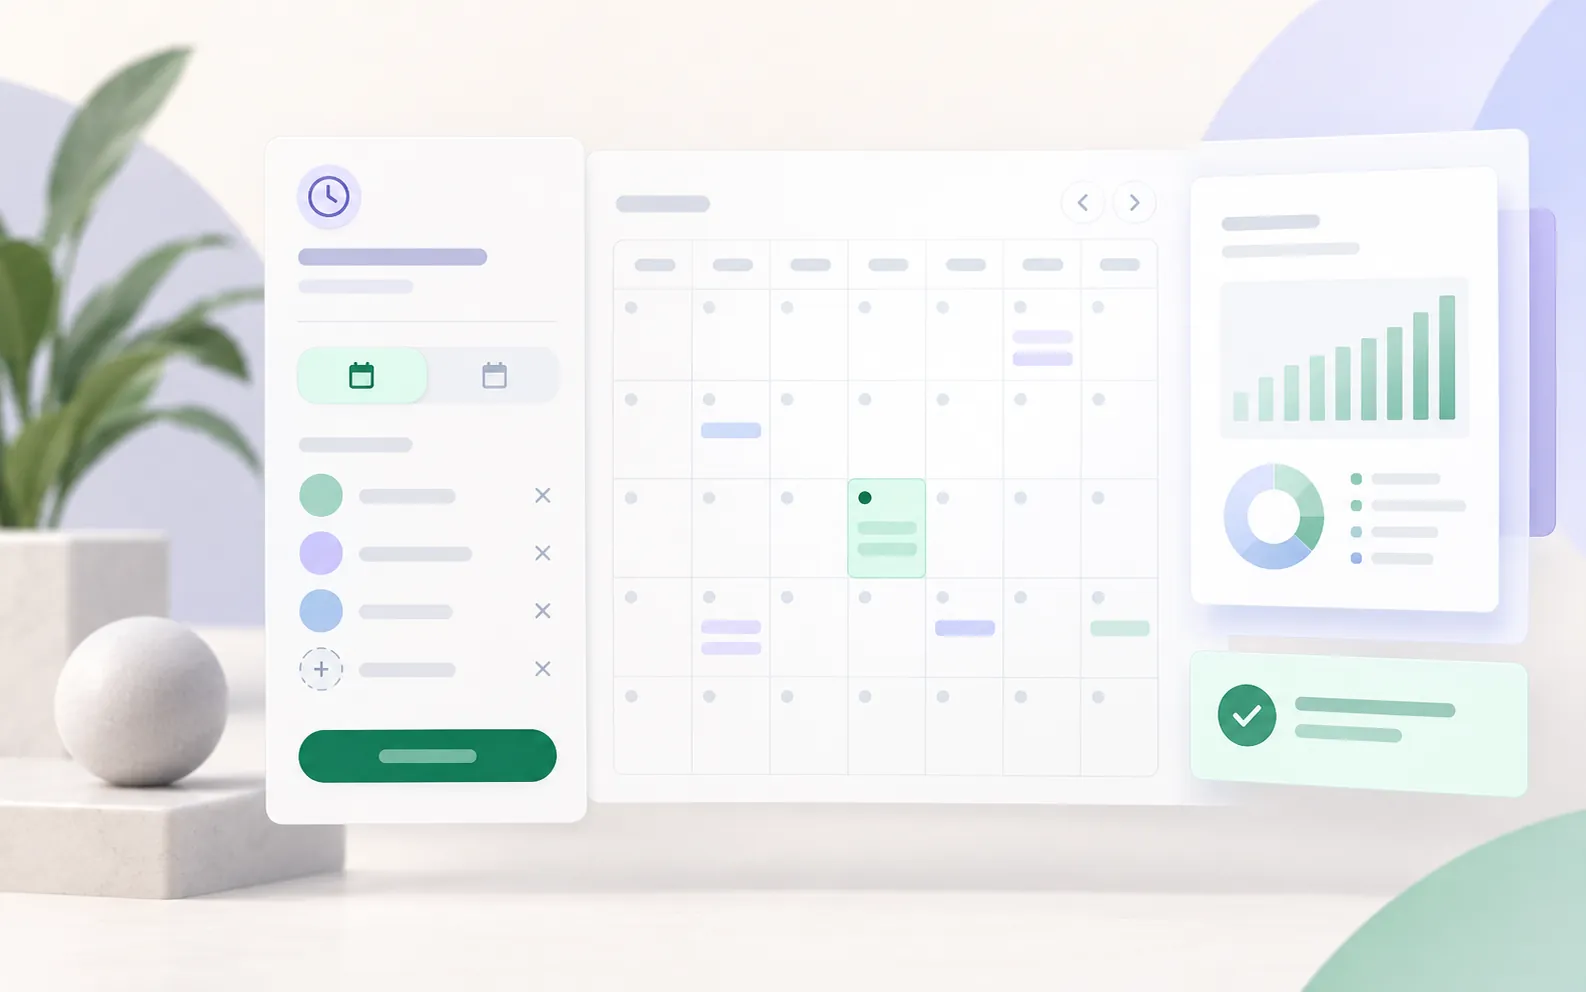
The report carries the period, comparison, source note and data-through date beside the numbers, so a reader can understand what changed without needing a tour of the dashboard.
7, 28, 90, 180 or 365 days, compared with the previous period or with nothing at all.
On demand, weekly on Mondays at 06:00 UTC, or monthly on the 1st at 06:00 UTC. How many reports can be scheduled depends on your plan; any saved report can always be run on demand.
Up to 25 recipients per report. Run history keeps the last runs with their status, so you can see if one failed and why.
Download the full CSV — on-screen tables cap at 25 rows, the CSV has all of them — or use your browser's Print / Save as PDF for a clean document.
Owners, admins and members can create and run reports. Viewers can read them.
The point of a report is that somebody else reads it without you in the room. So it explains itself.
Google Search Console, with the note that positions are impression-weighted averages and that Google finalises each day after about three days.
The header shows the period, the comparison period, the date the data runs through, and when the report was generated.
If part of the period was not imported, the report says so. If the comparison period is only partly imported, it warns that changes may look larger than they are.
Owners, admins and members can create and run reports; viewers can read them. White-label output is not offered on the current plans, so no page here sells it.
Being clear about the edges is part of the product. These are deliberate limits, not gaps we are hoping you will miss.
Connect a property and this page becomes your numbers. Free to start.